spark is the profiler for Minecraft servers. When the server stutters, spark tells you within seconds whether the tick rate suffers, which plugins or farms eat the time and whether CPU or memory are at the limit. This guide shows the three commands you really need and how to read the numbers. The screenshots come from a test server running Paper 1.21.4.
Installation
spark runs as a plugin on Paper and Spigot and as a mod on Fabric, NeoForge and Forge. In the panel you find it under Plugins → Browser. It needs no configuration. The commands belong in the moderation group; the node is called spark. How to grant it is covered in LuckPerms: permissions setup.
First look: TPS and tick duration
/spark tps prints three lines:
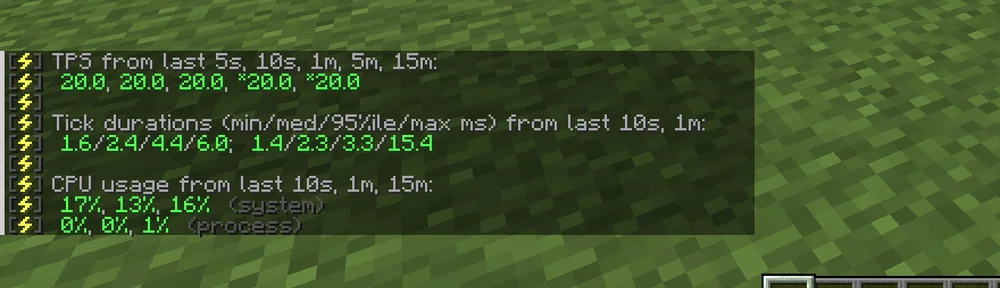
- TPS (ticks per second) over the last 5 seconds, 10 seconds, 1, 5 and 15 minutes. 20.0 is the maximum. Down to about 19 players notice nothing, below 15 animals move in jerks, below 10 the server becomes unplayable.
- Tick duration as minimum, median, 95th percentile and maximum in milliseconds. A tick may take 50 ms to hold 20 TPS. In the picture the median is 2.4 ms, so the server has plenty of headroom. The 95th percentile is what matters: if it sits near 50 ms, stutters appear even though the average looks fine.
- CPU usage split into system (the whole machine) and process (only your server). On a rented server the process value is the relevant one.
/spark healthreport combines the same values with memory and disk into one report.
The profiler: who eats the time?
When TPS drop, start the profiler:
/spark profiler start
spark confirms the start and keeps running in the background. Let it run for at least a minute while the problem occurs, then:
/spark profiler stop
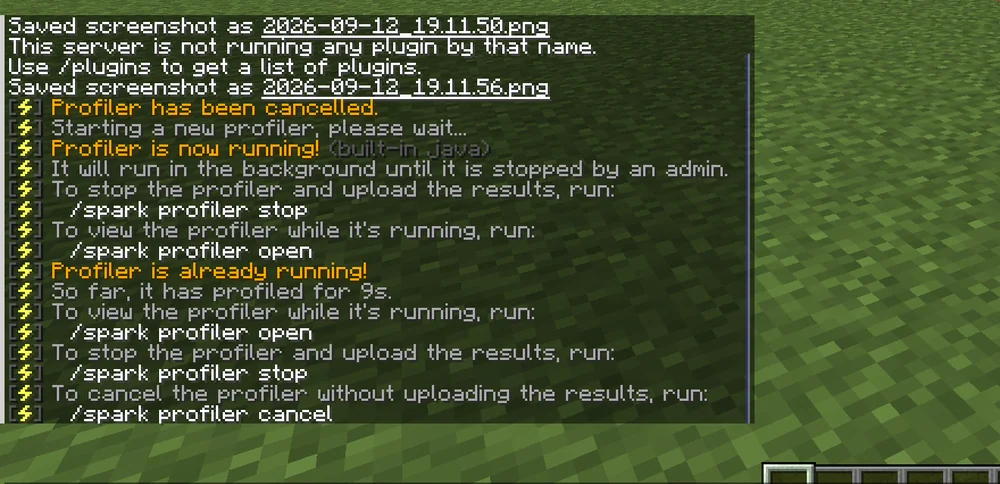
On stop spark uploads the report to spark.lucko.me and prints a link. The report contains no player names, no IP addresses and no chat messages, only call trees of the Java process. /spark profiler open opens it while it is still running, /spark profiler cancel discards it without uploading.
In the report you expand the tree from the top. What you typically find:
- Entity ticks of one particular type: a farm with hundreds of animals or items. Shrink the farm or calm it with
entity-activation-rangeinpaper-world-defaults.yml. - One plugin inside an event listener: update the plugin, check its configuration or replace it.
- Chunk loading by players flying fast: lower the view distance or pre-generate the world with Chunky.
- Redstone clocks: a circuit that never stops. Ask the player to switch it off.
Garbage collection and memory
/spark gc shows how often and how long Java's garbage collector pauses. Many long pauses mean too little RAM or a memory leak in a plugin. /spark heapsummary lists which object types occupy memory. Before booking more RAM, look here: a plugin update often solves the problem.
Common mistakes
- TPS 20, still lag. The problem is on the client or in the network.
/spark pingshows latency per player. - Lost the profiler link.
/spark profilerwithout arguments shows the status; after stopping, the link is also printed in the server console. - Numbers without a baseline. A TPS value alone says little. Measure once with an empty server as reference.
Related guides
Generating a world in advance takes chunk loading off the server: Chunky: pre-generate the world. How the panel reports persistently low TPS is described in Minecraft server lag: TPS and watchdog.
Sources
- spark documentation: https://spark.lucko.me/docs/
- Commands: https://spark.lucko.me/docs/Command-Usage
- Reading profiler reports: https://spark.lucko.me/docs/guides/Finding-lag-spikes